Dashboards and Cloud Solutions with R
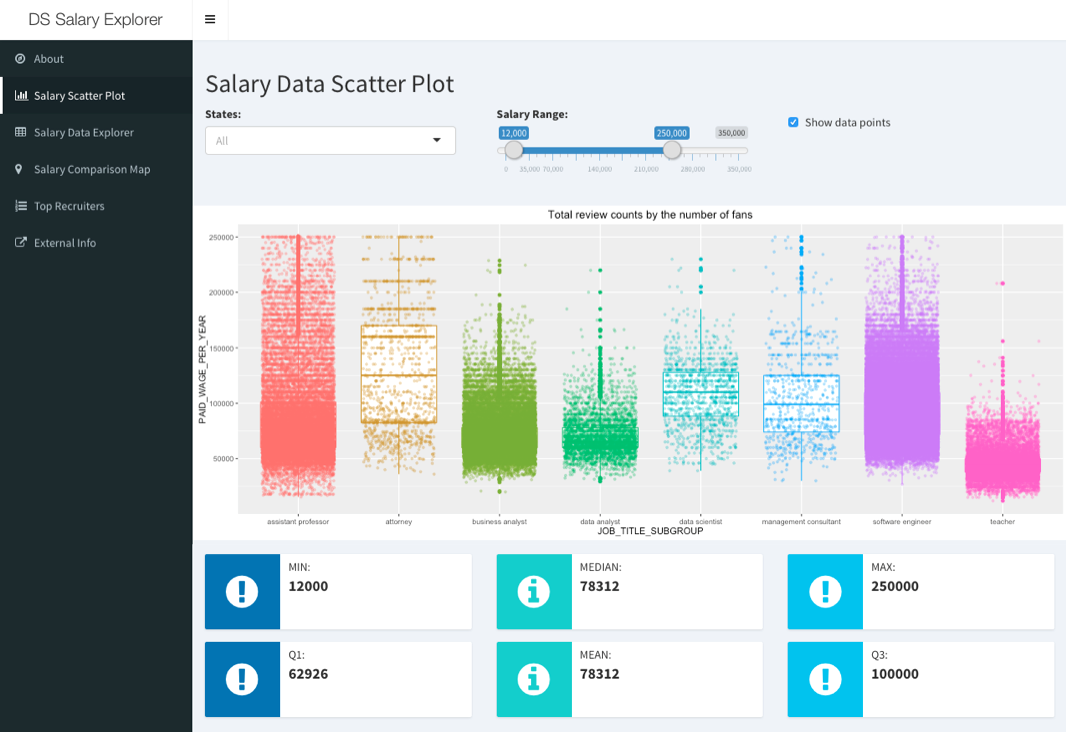
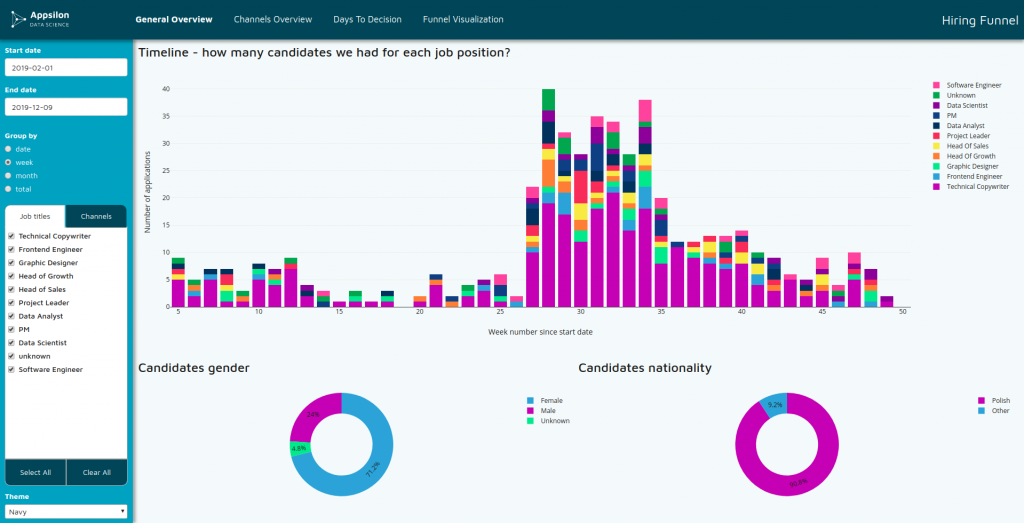
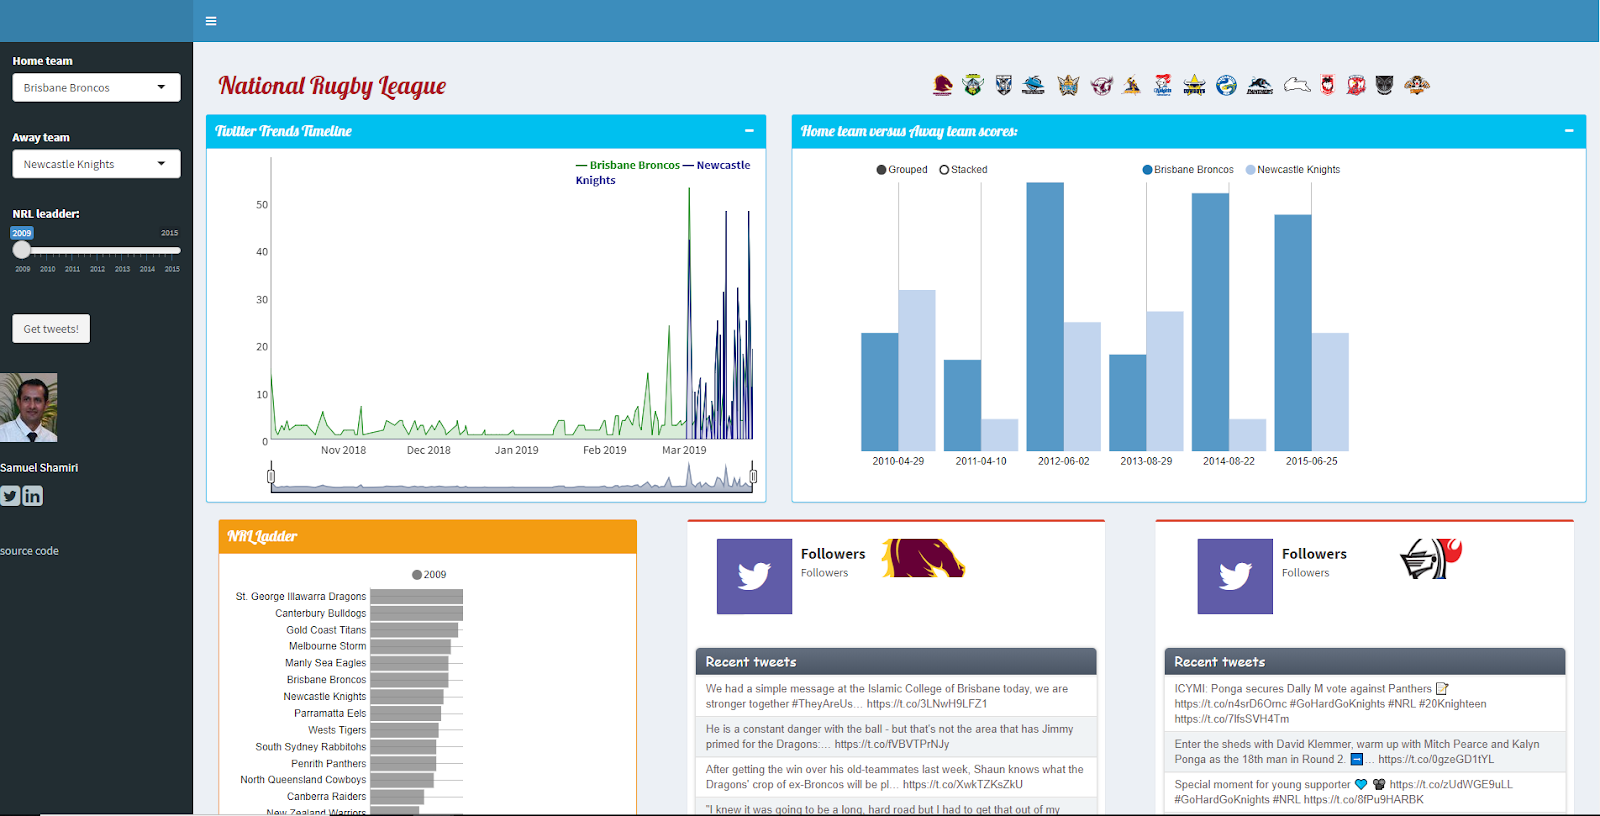
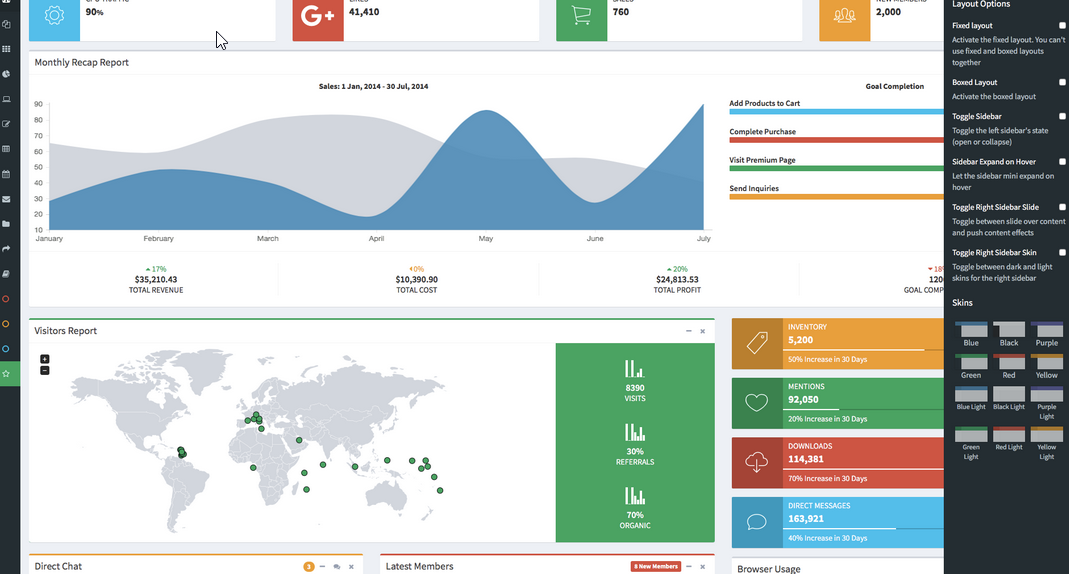
In this course you will learn how to build a pilot application with Shiny: an R framework suitable to express your data workflow and make it accessible as a nice web dashboard to anyone with a web browser. R and Shiny are an effective way to make a pilot program, which is a feasibility study on small-scale: short-term and inexpensive experiments that help an organization discover whether this project could be useful for their business.
Topics include
- Introduction to Shiny
- The role and importance of web dashboards
- Concept of user experience and main guidelines
- Standalone Application
- Basics of Reactive Programming
- Interactive Document (RMarkdown and Shiny)
- Dashboards
- Ggplot plot Integration
- HTMLWidgets Integration
- Data Table Interactivity
- Ggplot Interactivity
- Upload input data
- Download or export outputs
- Shiny Gadgets
- Introduction to Golem
- Share results
What you will be able to do
- Create an interactive dashboard
- Integrate powerful visualizations and interactions
- Improve your data exploration and presentation solutions
- Share your results online
Duration
1 or 2 days.
Pre requisites
- Basics of R programming and Tidyverse
- Nice to have: Dplyr or SQL basics and Ggplot2 experience
Audience
This course is a fundamental for every business area. It is especially useful for professionals that need to create a easy-to-use graphical interface to navigate data and their analysis as well as share them on-line.